
![Is It Still a Seller's Market? Here's What the Data Says. Remember a few years back when sellers held all the power and buyers were stuck offering way over asking or waiving inspections just to get a chance at the house? In many markets, those days are behind us. While it’s going to vary by area, more metros are slowly shifting to favor buyers, and the market is starting to look a lot more like a two-way street again. And that balance is something we haven’t had in a while. Whether you're buying or selling, here's what you need to know about what's changing and what it means for your move. The Most Buyer-Friendly Market in YearsThe national data tells an interesting story right now. According to Realtor.com: "The national housing market is balanced but gradually loosening as the cycle moves in a more buyer-friendly direction . . ." That’s because, over the past few years, more and more metros have been flipping back to more buyer-friendly terms as inventory’s grown. And when you zoom in on the latest Realtor.com data for the top 50 metro markets over time, the trend becomes really clear (see graph below). Back in 2021, almost all major metros were seller's markets. By the end of 2025, only 1 in 3 still favored sellers. That's an obvious shift. And that changes how the market is going to feel for everyone. Sellers shouldn’t still expect 2021 conditions, but neither should buyers. At least, not generally speaking. It’s Not the Same Story EverywhereThat said, who has the power ultimately depends on where you live. While more metros are leaning buyer-friendly lately, there are still plenty of strong seller's markets right now, too. It really comes down to how much housing supply and demand there is in your area. And that varies enormously by region. Sun Belt cities like Austin, Tampa, and San Antonio saw major building booms in recent years, giving buyers more options and more negotiating room. Meanwhile, cities in the Northeast and Midwest – think Rochester, Hartford, and Buffalo – didn't see that same wave, so inventory stayed tight and competition stayed fierce. As Jeff Ostrowski, Housing Analyst at Bankrate, explains: “The formerly hot Sun Belt markets have cooled, while the Northeast and Midwest have stayed hot. The big driver here is construction activity. The softest markets now [have] experienced big booms that spurred new building, and that has led to a large supply of new and existing homes on the market in those places.” Practical Advice for Your MoveTo find out who has the power in your local market, talk to an agent. Because knowing what’s happening locally is going to be the key to setting the right strategy for your move. If the market is working in your favor, great. Lean in and use it to your benefit. But if it’s not, all hope isn’t lost. Your agent can help you figure out how to approach any market. Here's some practical advice if there’s a mismatch between your goal and local market conditions. If you're buying in a seller's market: - Get pre-approved before you start shopping. It shows sellers you're serious. - Be ready to act fast when the right home hits the market. - Consider offering a quick closing date or flexible terms. - Work closely with your agent to craft a competitive offer. If you're selling in a buyer's market: - Price it right from day one. Overpricing will cost you time and money. - Focus on curb appeal and staging to stand out in areas with more inventory. - Be open to offering incentives, like covering closing costs or a home warranty. - Expect buyers to negotiate and be ready to be flexible. Bottom LineRight now, local markets are moving in very different directions. And your strategy as a buyer or seller should reflect your market. Is It Still a Seller's Market? Here's What the Data Says.](https://alstonhomes.com/wp-content/uploads/6-18-26-218x150.png "Is It Still a Seller’s Market? Here’s What the Data Says.")


With all the headlines and talk in the media about the shift in the housing market, you might be thinking this is a housing bubble. It’s only natural for those thoughts to creep in that make you think it could be a repeat of what took place in 2008. But the good news is, there’s concrete data to show why this is nothing like the last time.
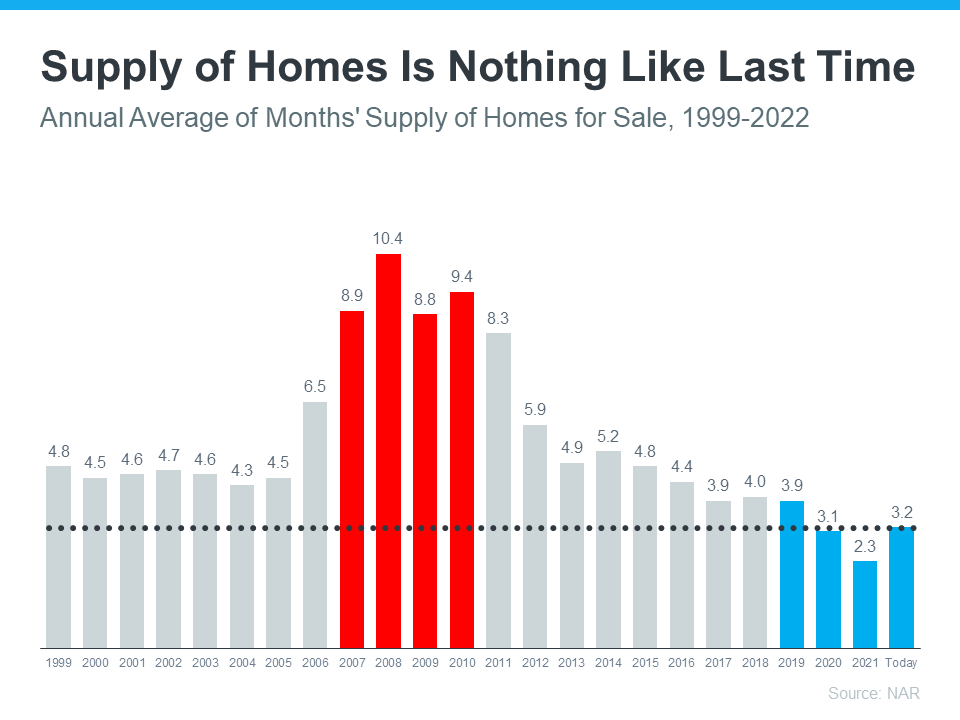
There’s Still a Shortage of Homes on the Market Today, Not a Surplus
For historical context, there were too many homes for sale during the housing crisis (many of which were short sales and foreclosures), and that caused prices to fall dramatically. Supply has increased since the start of this year, but there’s still a shortage of inventory available overall, primarily due to almost 15 years of underbuilding homes.
The graph below uses data from the National Association of Realtors (NAR) to show how the months’ supply of homes available now compares to the crash. Today, unsold inventory sits at just a 3.2-months’ supply at the current sales pace, which is significantly lower than the last time. There just isn’t enough inventory on the market for home prices to come crashing down like they did last time, even though some overheated markets may experience slight declines.
Mortgage Standards Were Much More Relaxed Back Then
During the lead-up to the housing crisis, it was much easier to get a home loan than it is today. Running up to 2006, banks were creating artificial demand by lowering lending standards and making it easy for just about anyone to qualify for a home loan or refinance their current home.
Back then, lending institutions took on much greater risk in both the person and the mortgage products offered. That led to mass defaults, foreclosures, and falling prices. Today, things are different, and purchasers face much higher standards from mortgage companies.
The graph below uses Mortgage Credit Availability Index (MCAI) data from the Mortgage Bankers Association (MBA) to help tell this story. In that index, the higher the number, the easier it is to get a mortgage. The lower the number, the harder it is. In the latest report, the index fell by 5.4%, indicating standards are tightening.
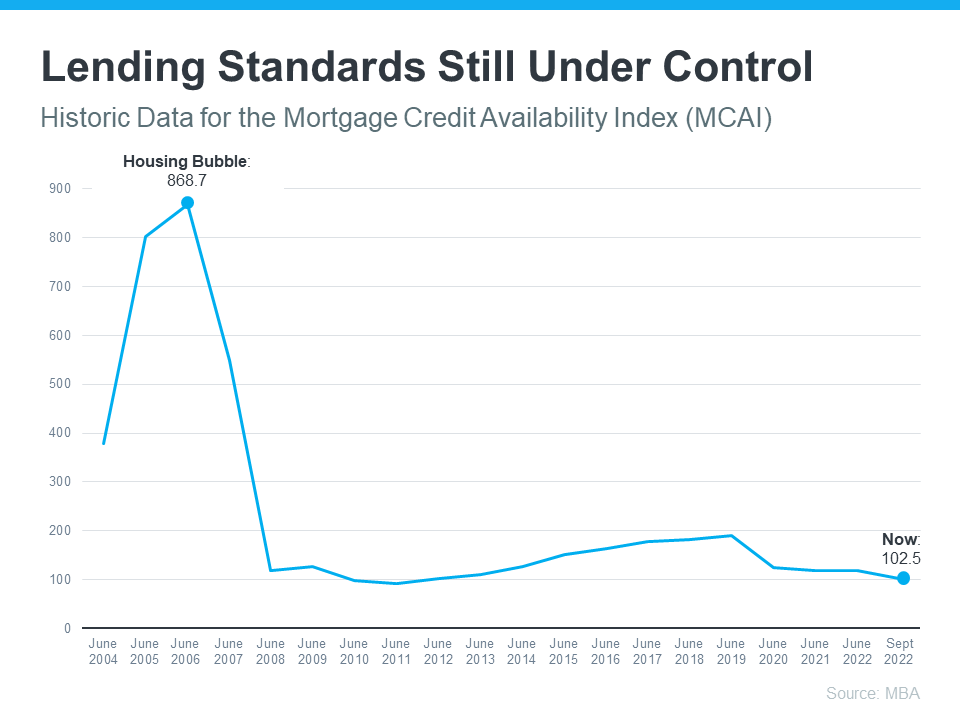
This graph also shows just how different things are today compared to the spike in credit availability leading up to the crash. Tighter lending standards over the past 14 years have helped prevent a scenario that would lead to a wave of foreclosures like the last time.
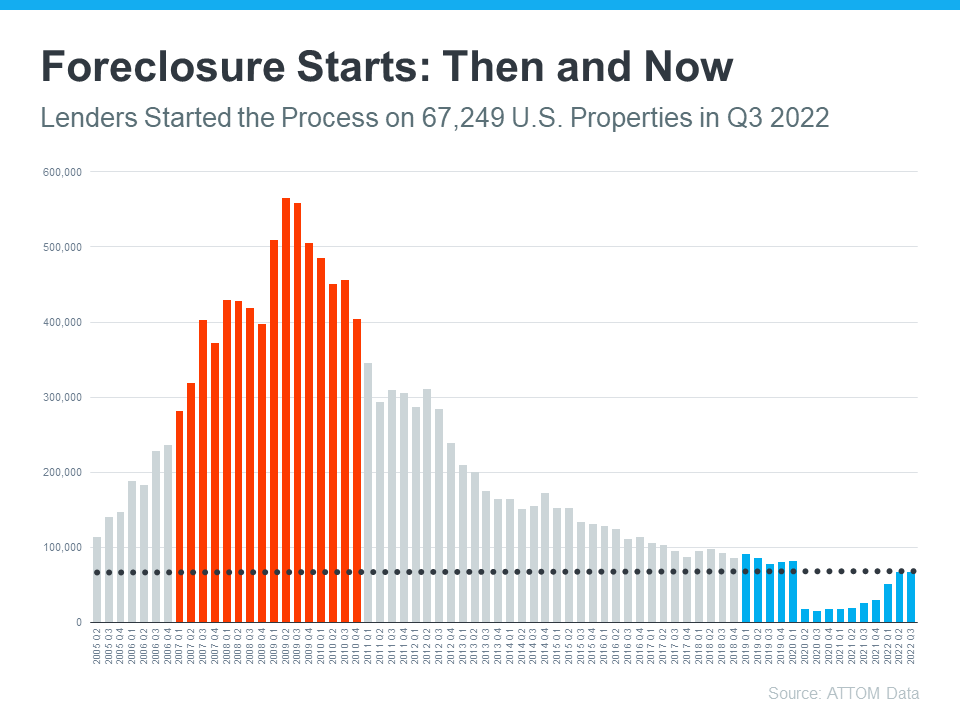
The Foreclosure Volume Is Nothing Like It Was During the Crash
Another difference is the number of homeowners that were facing foreclosure after the housing bubble burst. Foreclosure activity has been lower since the crash, largely because buyers today are more qualified and less likely to default on their loans. The graph below uses data from ATTOM Data Solutions to help paint the picture of how different things are this time:
Not to mention, homeowners today have options they just didn’t have in the housing crisis when so many people owed more on their mortgages than their homes were worth. Today, many homeowners are equity rich. That equity comes, in large part, from the way home prices have appreciated over time. According to CoreLogic:
“The total average equity per borrower has now reached almost $300,000, the highest in the data series.”
Rick Sharga, Executive VP of Market Intelligence at ATTOM Data, explains the impact this has:
“Very few of the properties entering the foreclosure process have reverted to the lender at the end of the foreclosure. . . . We believe that this may be an indication that borrowers are leveraging their equity and selling their homes rather than risking the loss of their equity in a foreclosure auction.”
This goes to show homeowners are in a completely different position this time. For those facing challenges today, many have the option to use their equity to sell their house and avoid the foreclosure process.
Bottom Line
If you’re concerned we’re making the same mistakes that led to the housing crash, the graphs above should help alleviate your fears. Concrete data and expert insights clearly show why this is nothing like the last time.


