

![Is It Still a Seller's Market? Here's What the Data Says. Remember a few years back when sellers held all the power and buyers were stuck offering way over asking or waiving inspections just to get a chance at the house? In many markets, those days are behind us. While it’s going to vary by area, more metros are slowly shifting to favor buyers, and the market is starting to look a lot more like a two-way street again. And that balance is something we haven’t had in a while. Whether you're buying or selling, here's what you need to know about what's changing and what it means for your move. The Most Buyer-Friendly Market in YearsThe national data tells an interesting story right now. According to Realtor.com: "The national housing market is balanced but gradually loosening as the cycle moves in a more buyer-friendly direction . . ." That’s because, over the past few years, more and more metros have been flipping back to more buyer-friendly terms as inventory’s grown. And when you zoom in on the latest Realtor.com data for the top 50 metro markets over time, the trend becomes really clear (see graph below). Back in 2021, almost all major metros were seller's markets. By the end of 2025, only 1 in 3 still favored sellers. That's an obvious shift. And that changes how the market is going to feel for everyone. Sellers shouldn’t still expect 2021 conditions, but neither should buyers. At least, not generally speaking. It’s Not the Same Story EverywhereThat said, who has the power ultimately depends on where you live. While more metros are leaning buyer-friendly lately, there are still plenty of strong seller's markets right now, too. It really comes down to how much housing supply and demand there is in your area. And that varies enormously by region. Sun Belt cities like Austin, Tampa, and San Antonio saw major building booms in recent years, giving buyers more options and more negotiating room. Meanwhile, cities in the Northeast and Midwest – think Rochester, Hartford, and Buffalo – didn't see that same wave, so inventory stayed tight and competition stayed fierce. As Jeff Ostrowski, Housing Analyst at Bankrate, explains: “The formerly hot Sun Belt markets have cooled, while the Northeast and Midwest have stayed hot. The big driver here is construction activity. The softest markets now [have] experienced big booms that spurred new building, and that has led to a large supply of new and existing homes on the market in those places.” Practical Advice for Your MoveTo find out who has the power in your local market, talk to an agent. Because knowing what’s happening locally is going to be the key to setting the right strategy for your move. If the market is working in your favor, great. Lean in and use it to your benefit. But if it’s not, all hope isn’t lost. Your agent can help you figure out how to approach any market. Here's some practical advice if there’s a mismatch between your goal and local market conditions. If you're buying in a seller's market: - Get pre-approved before you start shopping. It shows sellers you're serious. - Be ready to act fast when the right home hits the market. - Consider offering a quick closing date or flexible terms. - Work closely with your agent to craft a competitive offer. If you're selling in a buyer's market: - Price it right from day one. Overpricing will cost you time and money. - Focus on curb appeal and staging to stand out in areas with more inventory. - Be open to offering incentives, like covering closing costs or a home warranty. - Expect buyers to negotiate and be ready to be flexible. Bottom LineRight now, local markets are moving in very different directions. And your strategy as a buyer or seller should reflect your market. Is It Still a Seller's Market? Here's What the Data Says.](https://alstonhomes.com/wp-content/uploads/6-18-26-218x150.png "Is It Still a Seller’s Market? Here’s What the Data Says.")


You’ve probably seen the headlines saying, “foreclosures are on the rise,” and maybe your mind jumped straight to 2008. That’s understandable. A lot of people remember that crash and all the foreclosures that happened during that window, and they’re hoping something like that never happens again.
But this isn’t a repeat of what happened back then. Here’s the context to prove it.
Foreclosures Are Rising, But They’re Still Historically Low
Yes, foreclosure filings are up 26% from a year ago, according to ATTOM. And they’ve been rising for 5 straight quarters. That’s a real trend worth paying attention to. But the full picture isn’t scary like the headlines suggest.
The reality is the increase we’re seeing is a sign of the market normalizing.
Here’s an important thing to know about this chart. The extremely low numbers you see in 2020 and 2021 don’t represent what’s “normal.” That’s when the government put a moratorium on foreclosures to help homeowners get through the pandemic. Those years were an exception, not the baseline.
Instead, compare where we are today to 2017, 2018, and 2019 – the last years the market was running normally. Today’s numbers are still lower. So, we’re not even back to what’s typical, yet. That means this can’t be a crash. (see graph below):
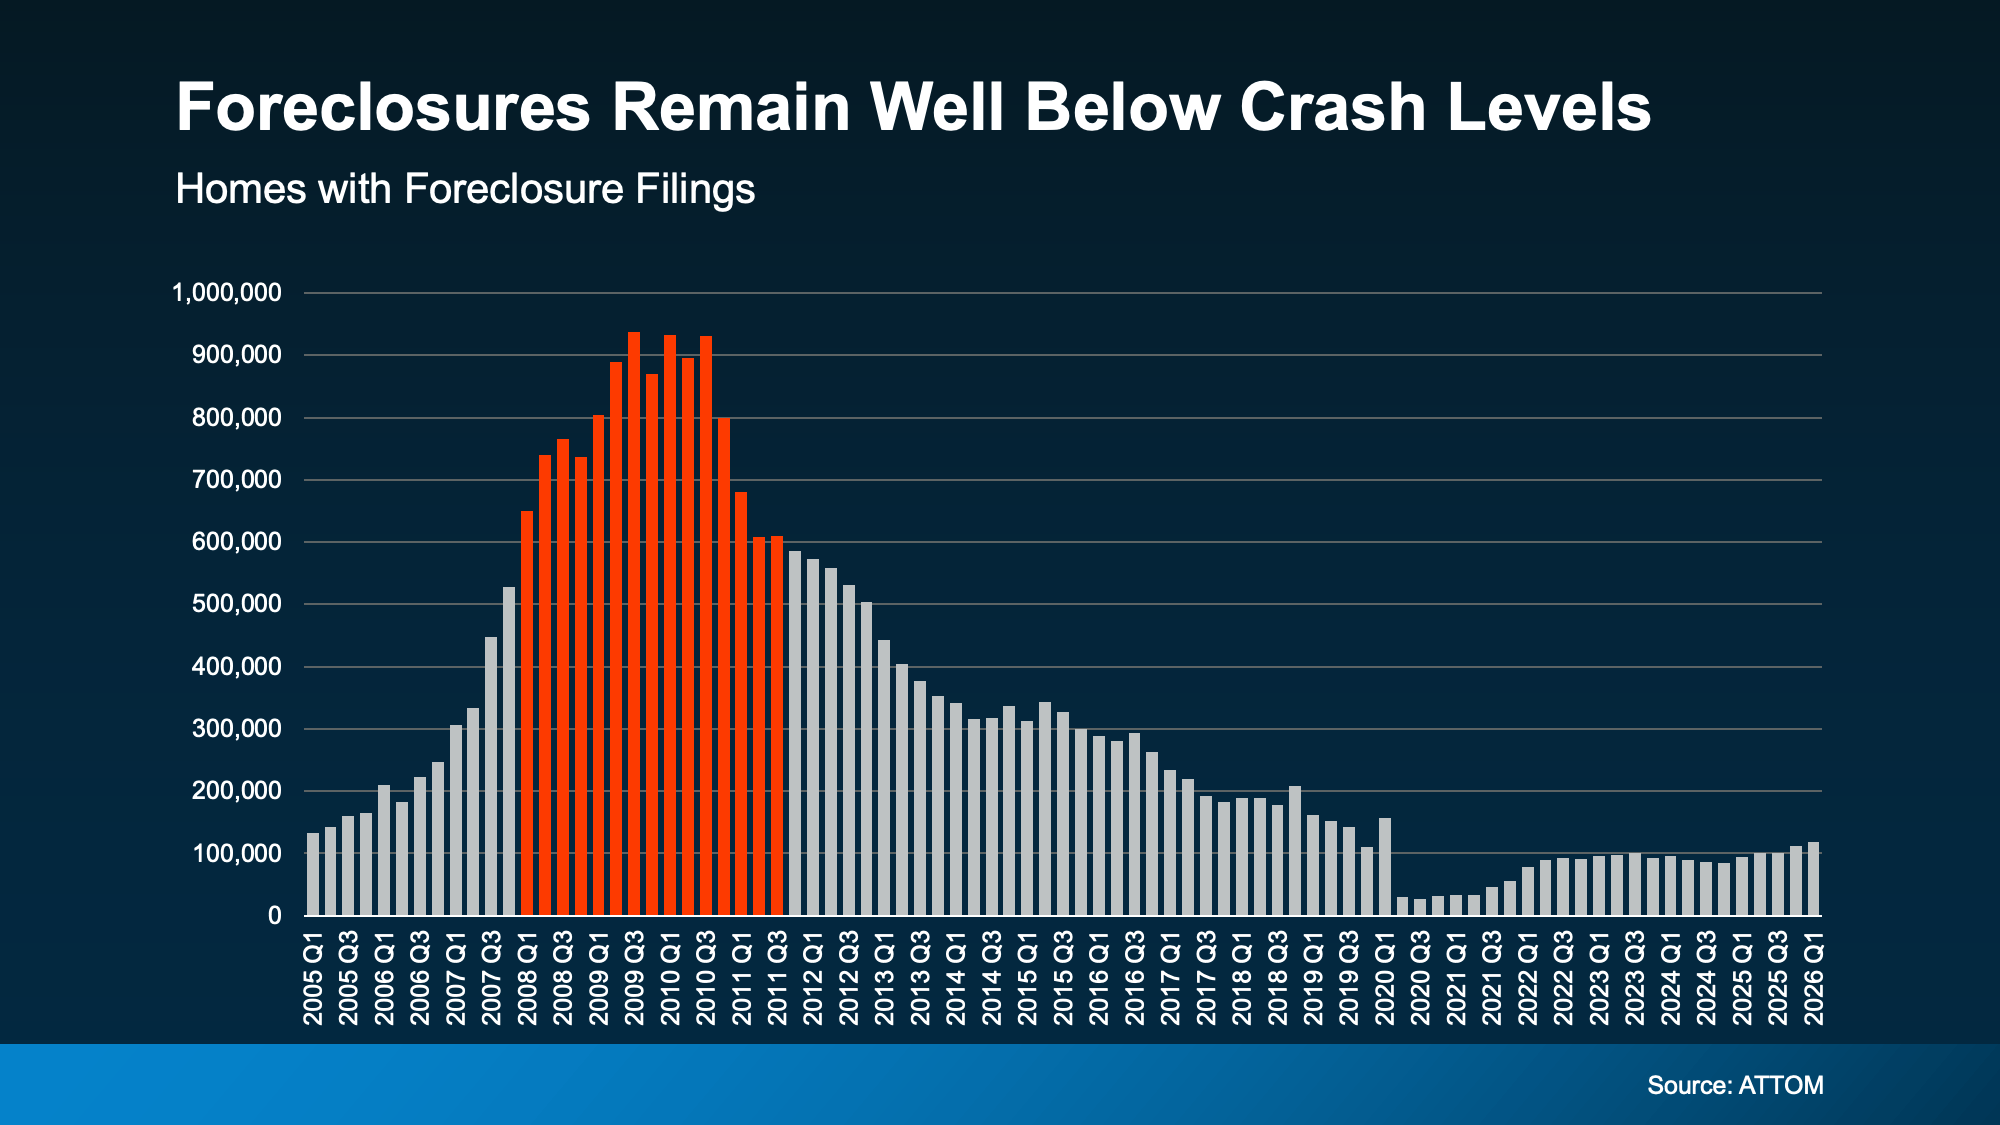 While today’s numbers are getting closer to pre-pandemic levels, they’re still below historical norms. And just look at what was happening around 2008. Even with the recent increase, we’re nowhere near those levels. This is a market returning to normal, not heading toward a crisis.
Why Today’s Equity Picture Changes Everything
Most of those filings won’t even end in a completed foreclosure. That’s because today’s homeowners have something most people in 2008 simply didn’t have. And that’s equity.
The average homeowner today is sitting on roughly $295,000 in home equity right now, according to Cotality. Back in 2008, many people owed more than their homes were worth. Selling wasn’t an option. And foreclosure was often the only door available.
Today, that’s not the case. If you have enough equity to cover what you owe and the cost of selling, you could sell your home, pay off your debt, protect your credit, and potentially walk away with money in your pocket.
That’s a completely different situation than what homeowners faced during the last crash, and it’s a big reason we’re unlikely to see foreclosures spiral the way they did back then.
Check out the graph below. It shows foreclosure data from ATTOM going back to 2005. Here’s how to read it:
- The yellow line tracks all foreclosure filings.
- The orange line tracks foreclosure starts, meaning the process has officially begun.
- And the red line at the bottom tracks completed foreclosures (the ones where a homeowner actually lost their home).
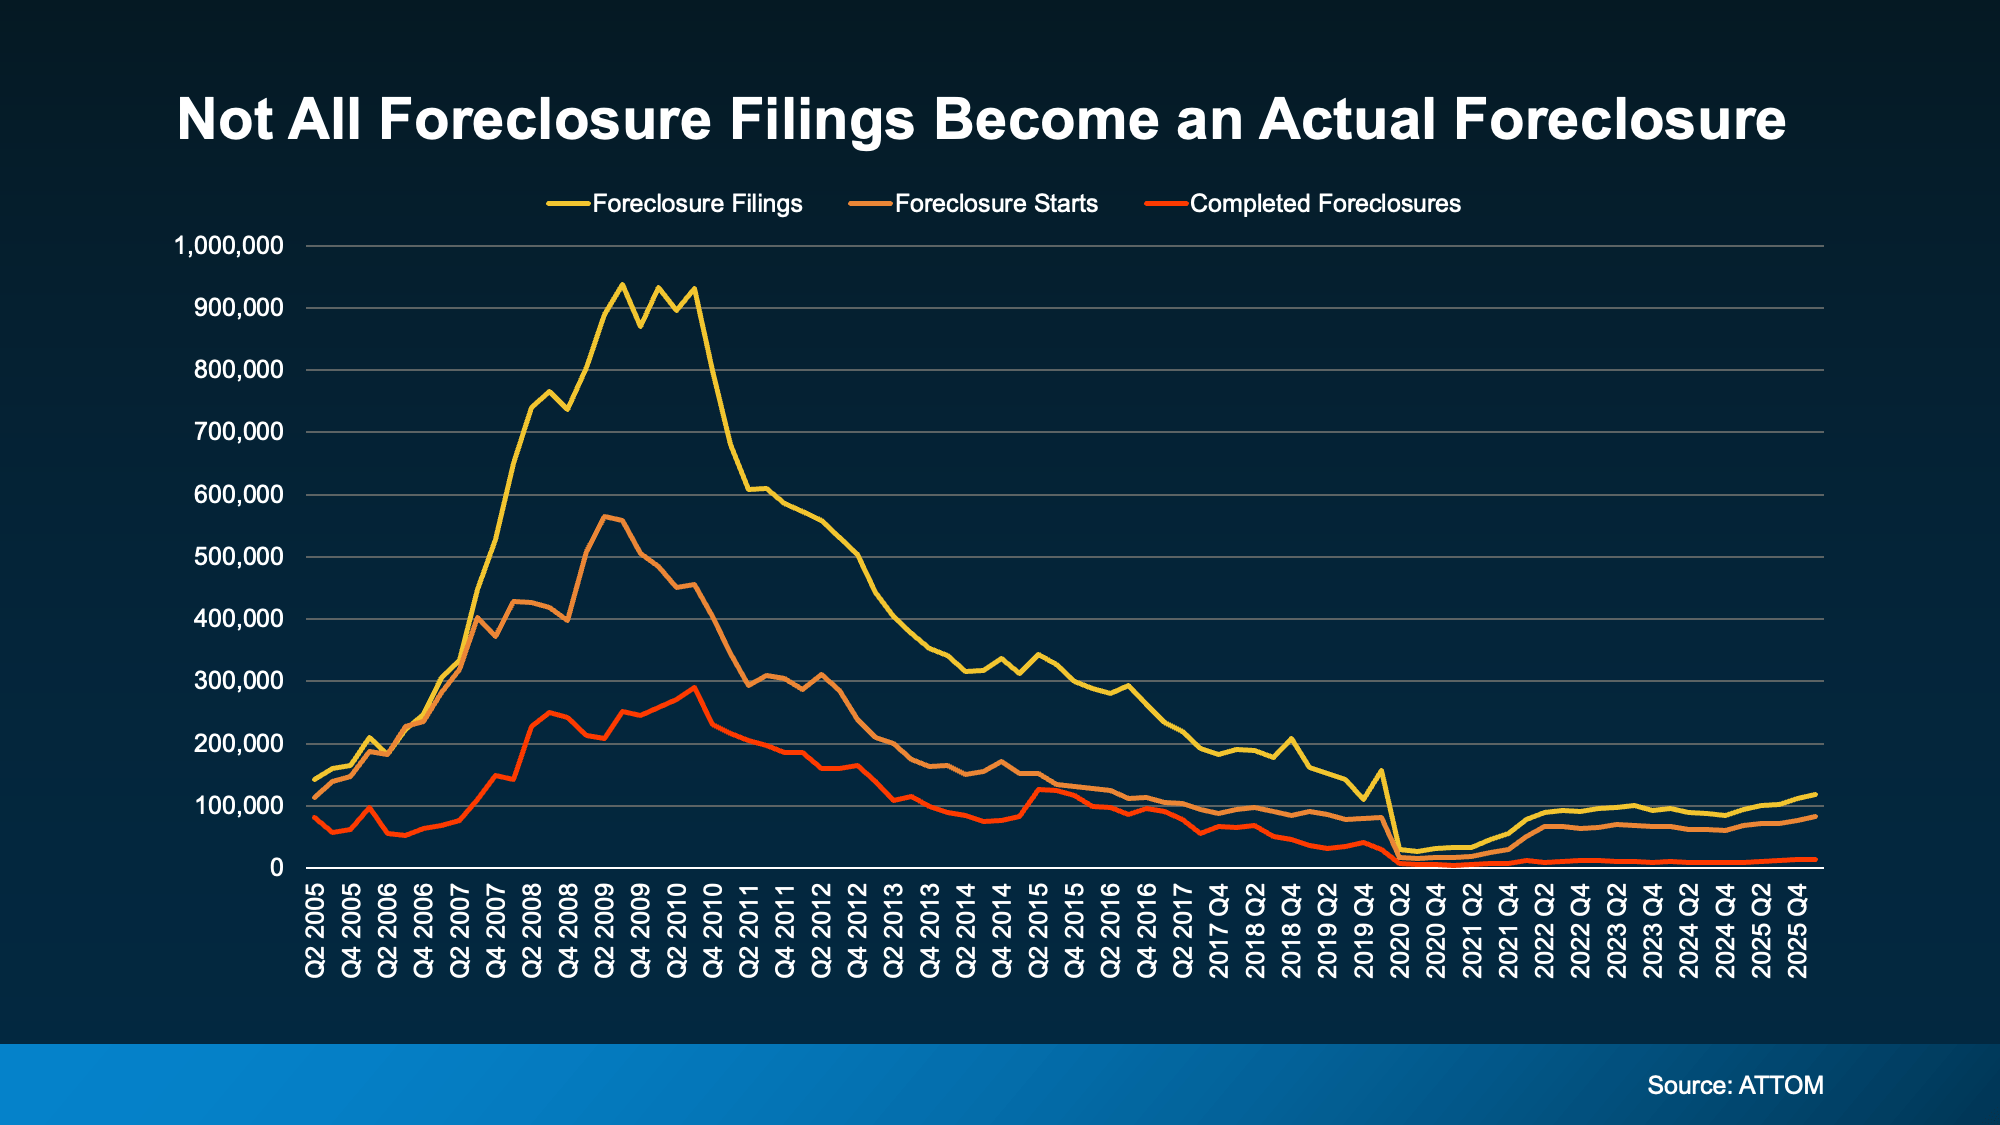 See how the red line stays well below the other two? That gap tells the real story. A lot of homeowners who enter the foreclosure process never end up losing their home because they find another way forward first.
Today’s equity is a big reason for that. So, even the filings we are seeing now won’t all end in foreclosure.
If You’re Struggling, You Have More Options Than You Think
Maybe you’re behind on payments. Maybe you’re stressed about what comes next. That’s an incredibly hard place to be, but it’s important to know that missing a payment or two doesn’t automatically mean you’ll lose your home.
Banks would much rather work with you than foreclose. It’s a complicated, costly process for them, too. They’re often willing to set up a repayment plan, offer forbearance (a temporary pause or reduction in your payments), or modify your loan to make things more manageable long-term.
Just know the sooner you reach out to your lender, the more options you’ll have. In some states (ones that don’t require the foreclosure process to go through a court) things can move faster than people expect. Getting ahead of it early gives you and your lender the most room to find a solution.
And if selling makes more sense for your situation, a real estate agent can help you understand what your home is worth and whether that’s a path worth exploring.
Bottom Line
Foreclosure filings may be rising, but they’re still low. And the equity most homeowners are sitting on today is a key reason this looks nothing like 2008.


